In every election, there are those who go to the polls but abstain from voting. This is a fact that might shock some liberals. The very idea that not only would someone stand in line to vote, but would do so only to cast no vote at all, and instead submit a blank ballot, likely does not compute for them. Let’s explore this phenomenon a little, shall we?
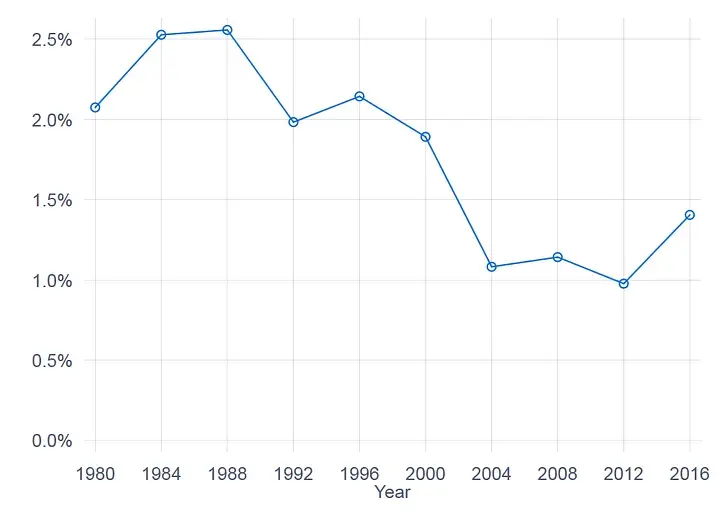
A blank ballot, or blank vote, is what is known as an “undervote”. Undervotes, however, also include voting technology errors. The 2000 presidential election is notorious for its voting technology issues. Some might remember the news going on and on about the “Hanging Chads”, eventually leading to the Supreme Court halting the recount of ballots in Florida, leading to the upset win for G.W. Bush. Undervotes are part of a calculation that is known as the “Residual Vote”, which is determined by the undervotes (blanks) and overvotes (e.g. voting for both candidates for president on the same ballet, sometimes caused by ink smudges or ruined ballots). From 2000 to 2004 you can see a massive drop-off in the national Residual Vote Rate, which was due to a change in voting technology driven by the hanging chads in Florida.

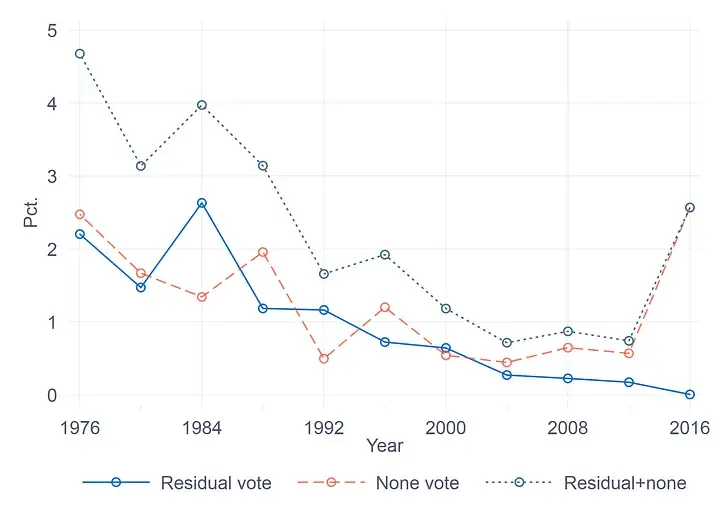
In the 1970s, following Watergate, Nevada added a new option to their ballot called “none of these candidates.” It is the only state in the union that allows its electorate to voice their dissatisfaction with the candidates in an official capacity. The result of this policy means that Nevada has one of the lowest Residual Vote Rates in the country, and is the only state where you can see a clear error rate with the voting technology, and tabulate a true abstain vote.

As you can see, in 2016, the undervote sits at almost 0% and the “none” vote sits at just around 2%. In the 2020 elections, “none” received 14,079 votes, putting it at just about 1%. Thus far, in this election (2024) “None” has received 1.2% of the vote.
When you look at the “None” results and compare them between 2016 and 2020 in Nevada, and then do a similar comparison between the Residual Vote Rate for other states, you notice something interesting.
Nevada “None” vote as % of Total Vote.
2016 | 2.564722295
2020 | 1.001795961
A % change of ~39%. Meaning, the number of people who voted “None” went down in 2020, this was while the total number of votes went up in 2020 by almost 80% in Nevada.
California “RVR” as % of Total Vote.
2016 | 2.55
2020 | 1.6
Michigan “RVR” as % of Total Vote.
2016 | 1.03
2020 | 0.63
Wisconsin “RVR” as % of Total Vote.
2016 | 0.93
2020 | 0.35
New York “RVR” as % of Total Vote.
2016 | 1.03
2020 | 0.58
Nearly very single state with data, according to elections.mit.edu, had their RVR drop by a significant amount. You can pull the site up and see a similar change but in the other direction by comparing the RVR between the 2012 and 2016 elections. There was a higher RVR in 2016 than there was in 2012.
What does this tell us exactly? Well, when you consider that Nevada’s true RVR has been dropping significantly over the decades, it’s a pretty clear indication that the error rate on voting technology for in-person voting has been getting better and better. Nevada is consistently one of the states with the lowest RVR due to its ability to separate out the protest votes from the errors.
If Nevada’s RVR is assumed to be as close to what the average TRUE RVR is given current voting technology, we can also assume then that a portion of the votes seen as RVR in other states can be assumed to be protest votes.
I predict that this year you are going to see a rise in the national RVR. Combine a rise in the RVR, with a low voter turn out, a rise in 3rd party voting, and very little voter conversions for either party, it should be clear to anyone looking at this data that the reason Harris lost this time around is that she did not excite the electorate enough to turn out and vote, or enraged a portion of them to abstain.
Ask any Liberal to explain to you why someone might stand in line at a polling both only to cast a ballot without filling in the presidential candidate intentionally, and what that means for this election, and electoralism generally, and watch them flop about like a fish out of water.
Sources:


Honestly, I was just trying to figure out the “none” votes history in previous elections. The site I found with data said “under and over votes have been removed” and I had to stop and figure out what an under vote was… This led me down a rabbit hole doing spreadsheet math instead of work. It seemed to obvious to be true once I stated looking at it.
Ive never once seen anyone talk about the “under vote”, and apparently over votes get caught by the ballot machines so you can fix it before you leave.
The blog is talking about tech reliability, but what they were also saying as a result is that protest votes are baked into the reliability data.
The fact that the reliability data fluctuates up and down has to mean that protest votes are going up and down. 2016 feels like an election someone would abstain from except for local and down ballot, just like this election.